


Map 3D toolset is included with AutoCAD
By Microsol Resources, Graitec Group | CAD
Work faster with access to model-based GIS mapping
Map 3D toolset features
Use Feature Data Objects (FDO) technology
Work with spatial data from a variety of CAD and GIS data formats and coordinate systems.
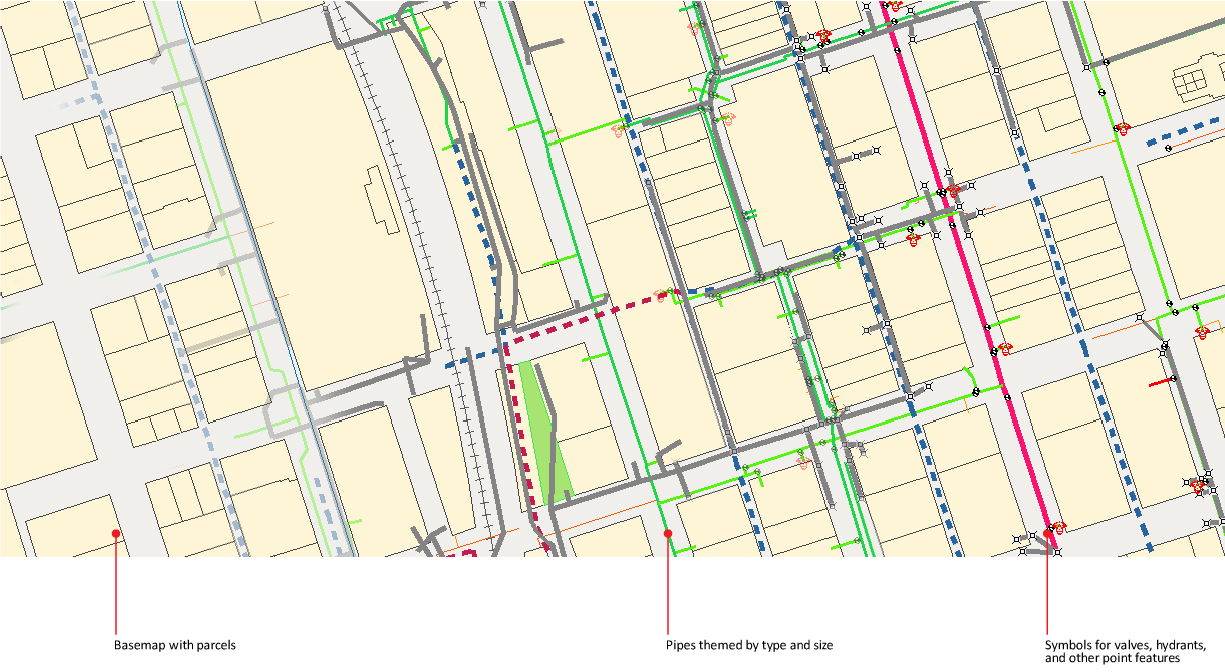
This map of a water distribution system is made up of features stored in a set of SDF files. The feature source could be a database (such as Oracle, SQL Server, or MySQL), a file-based feature source (such as SDF or SHP), a web server (such as WFS), or a table of feature geometry data (such as Microsoft Access).
Once you connect to a feature source, you select the types of features to include in your map. Each type of feature is called a feature class . AutoCAD Map 3D toolset displays all the features from the selected features classes in your map, and each feature class becomes a layer in Display Manager. For example, a feature class called Roads contains individual streets and appears on a layer called Roads in Display Manager. You can apply a single style to this layer, and all the streets in the layer will use that style.
A schema is the definition of multiple feature classes and the relationships between them. It determines the criteria an individual feature must meet in order to be a member of a particular feature class. For some feature sources, you can add and edit a schema and its feature classes and properties. For more information about editing schemas, see About Schemas.
For data stores that support multiple-geometry feature classes (Oracle, WFS, SDF, PostGIS, MySQL, SQL Server Spatial, SQLite, and SQL Server), you can specify which geometries to add to the map for each feature class.
You use FDO to connect directly to a data source and work in its native format. Each data source type uses its own FDO provider , and each provider has different capabilities.
For example, Oracle supports locking on the feature level. When you check out a feature, other users cannot edit it, even though they can view your edits and edit other features in the feature source. Oracle also supports persistent locking, so the object stays locked until you check it back in.
SHP feature sources, on the other hand, support locking on the file level. When you check out a feature, its entire SHP file is locked. Other users cannot edit features from that file until you close the map, which releases your lock (even if you still have features checked out at the time). Be careful to check in your changes before you close the map.
Versioning allows multiple copies of a spatial dataset to be stored and tracked by date of creation, date of change, and so on. Not every FDO provider supports versioning.
Connect to ArcGIS
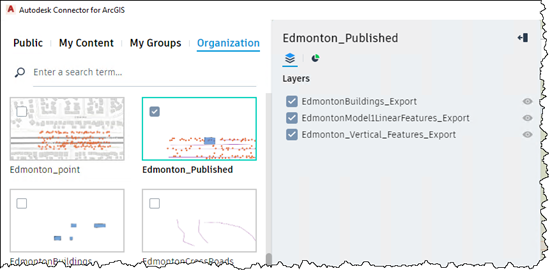
The Autodesk Connector for ArcGIS® uses your ESRI ArcGIS login information to connect AutoCAD Map 3D toolset to your ArcGIS data. Once you’ve signed in, use the Autodesk Connector for ArcGIS to browse available datasets and add ArcGIS data layers into your map drawing.
1. Open the Autodesk Connector for ArcGIS
The Autodesk Connector for ArcGIS can be launched from the AutoCAD Map 3D toolset Data panel by clicking on the  icon.
icon.
2. Navigate to your area of interest
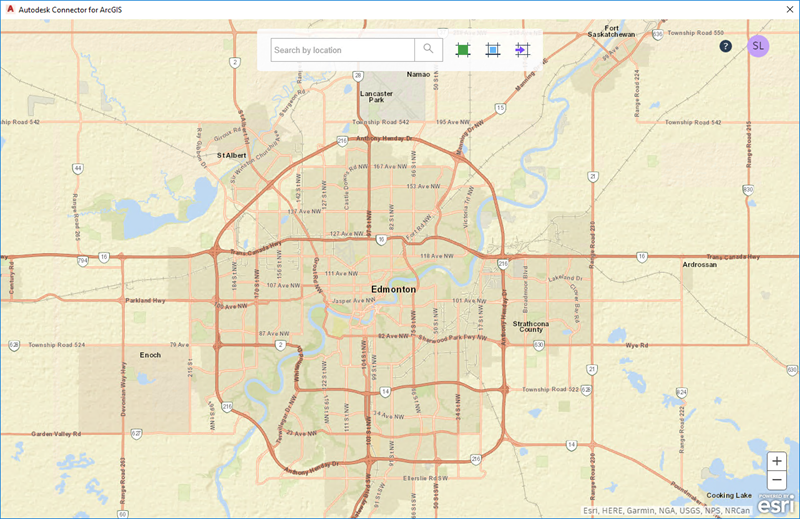
3. Browse datasets
Convert data between DWG and GIS data
 During import, AutoCAD Map 3D toolset copies data from the input file into the active drawing and converts the data to drawing objects. You can work with your data using Data Connect or by importing it.
When you use Data Connect (from Display Manager), you view and edit data in its source. Edits are saved back to the source. The data stays in its original location.
When you import data, you make a copy of the data and bring that copy into your map. When you edit the data, you are editing the copy. The original data is unchanged.
For some formats, such as MicroStation Design (DGN), Arc/INFO, and SDF 2 (Autodesk MapGuide 6.5 and earlier), you can only import the data. For most other formats, you can either connect directly to the data or use import.
Edit geospatial data directly
Edit data against GIS data sources, such as ESRI SHP, MapInfo, and Oracle with standard AutoCAD commands.
AutoCAD Map 3D toolset works on two types of objects: features and drawing objects.
- Features are GIS objects stored in external files and databases. Display and edit them in your map and then save the changes back to the original source. Use the options described in Working with Features.
- Drawing objects are AutoCAD objects stored within a map or retrieved from attached drawings using queries. Save changes to drawing objects in the current map or back to the attached source drawing depending on the source of each object.
AutoCAD Map 3D toolset works with both DWG objects and GIS features.
Use both AutoCAD Map 3D toolset and AutoCAD to edit features and drawing objects. Many AutoCAD commands work on both types of objects. Some AutoCAD commands can only be performed on a feature after you extract its geometry and edit it as a drawing object. You can then save your changes back to the original data store with no loss of precision.
Many AutoCAD Map 3D toolset Help topics are specific to one type of object or the other.
Topics that are for DWG objects are marked with this icon:
Topics that relate to GIS features have this icon: 
Apply coordinate geometry
Use coordinate geometry (COGO) input commands to enter accurate geometry when creating objects.
Use the coordinate geometry (COGO) input commands to enter accurate geometry when creating objects. For example, you can create parcel boundaries from legal documents or survey data.
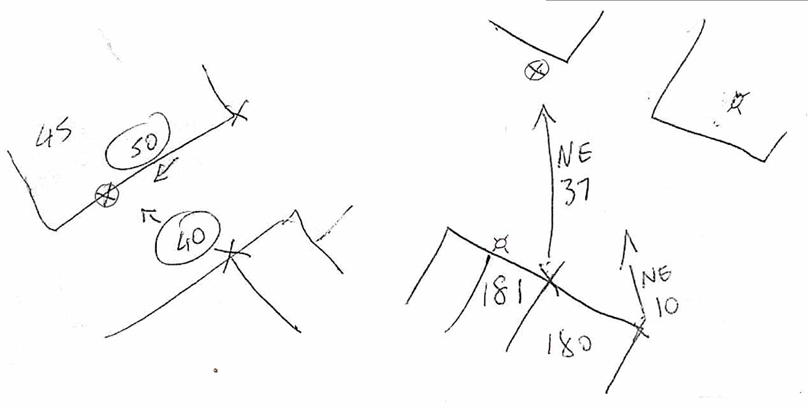
Typical field sketches showing points defined by distance-distance (left) and bearing-bearing (right).
You can access COGO commands from the COGO Input dialog box. The COGO Input dialog box is available on the ribbon as well as on the tool bar of the Task PaneSurvey tab. You can also enter COGO data “transparently” (while running other commands) by entering ‘mapcogo at the command prompt.
For example, start the Polyline (PLINE) command. When prompted for the next point in the polyline, enter ‘mapcogo. The COGO Input dialog box appears. Select a COGO routine, and enter the COGO data to calculate the new point. When you finish specifying the point, the Polyline command prompts you to enter the next point. You can enter the point normally, or you can start another transparent command to specify the point.
Note:
You can still access most COGO commands transparently by typing an apostrophe (‘) plus the command name (AD, BB, BD, DD, DDIST, ZD). Orthogonal/Offset and Inverse Report are only available from the COGO Input dialog box.
It can be very helpful to enable node object snapping when specifying points using coordinate geometry. Node object snapping allows you to snap to point objects in the drawing window, which makes selecting points much easier.
Run drawing cleanup actions
Use drawing cleanup to automate time-consuming corrections for common drafting and digitizing errors.
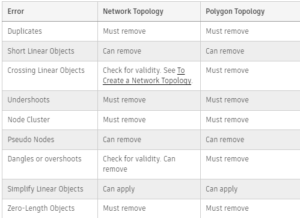
Drawing Cleanup actions can be used to detect map errors (for example, duplicate objects, undershoots, or zero length objects), simplify complex 2D maps, and to weed and supplement 3D polylines. Because Drawing Cleanup can alter your data, make a backup of your data before cleaning up a map.
For best results, run cleanup actions individually or with a minimum of other actions.
The following table shows examples of problems that Drawing Cleanup can correct.
Order of Cleanup Actions: The order of cleanup actions can produce different results. Specify the order by moving cleanup actions up or down in the list. The action at the top of the list is performed first.
Setting Cleanup Options: Set the options for each cleanup action individually. For more information, see the individual help topics about each cleanup action.
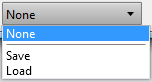
Cleaning for Topology: Some types of errors should be fixed before you create a topology. The following table indicates data errors that should be considered when you are creating a network or polygon topology. Node topologies do not usually require cleanup.
In addition, if you have closed polylines (polygons) that may be missing centroids, you should create centroids for them before using them in topology.
Notes
- Drawing Cleanup affects objects on layers that are OFF. It does not affect objects on layers that are FROZEN. It is recommended that you use drawing cleanup on a layer-by-layer basis, or on selective sets of layers. Avoid using automatic cleanup for all objects on all layers.
- All tools except Weed Polylines work in two dimensions only, ignoring Z-values. When you use the 2D tools, Z data (indicating elevations) might be lost when processing objects at different elevations.
Use enterprise industry modules
Use intelligent application modules to efficiently manage a wide variety of infrastructure systems.

Convert data to intelligent industry models
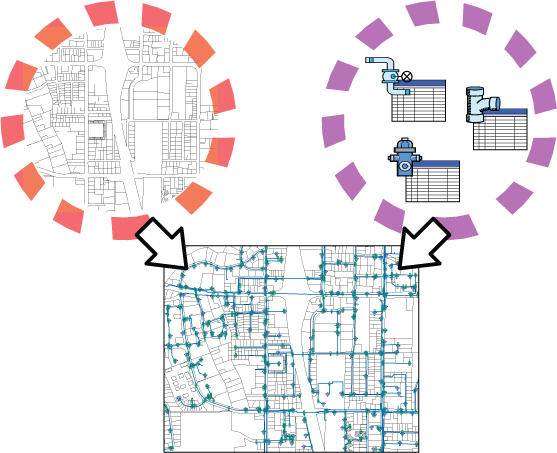
Create and manage intelligent industry models by converting GIS data.
The conversion process enables you to define mappings from the source data to corresponding feature classes and attribute values in the current industry model. You can convert multiple sources in one operation. You can apply filters to the sources to convert only the data of interest from each source.
To convert data to industry model features
- In AutoCAD Map 3D toolset, switch to the Maintenance workspace.
- Open a project or an industry model template or file.
The current industry model will be the target for the converted data.
 – Click .
- In the Convert to Industry Model dialog box, under Source Data, click any of the following:
 – Add File-based Sources. Use this option to convert data from DWG, SDF, SHP, and SQLite sources to design features.
 – Add FDO Connection Sources To Convert. Use this option to convert data from an FDO connection to design features. You must first connect to the source using .
 – Add Industry Model Sources To Convert. Use this option to convert data stored in previous versions of AutoCAD Map 3D toolset Enterprise. In this case, minimal mapping is needed.
 – After adding the source data and assigning an industry model, you can expedite the data mapping process by clicking the Automatic Mapping button.
Feature classes and their properties may not always have logical names. The mapping process allows you to set logical names that are easier to understand. For example, instead of using the feature class name like EL_OH_CONDUCTOR, it could be mapped as Conductor.
- If you have saved a mapping profile, at the bottom of the Source Data list, click Load and specify a saved mapping profile.
- Select and clear mapping check boxes as desired and click Convert.
You can select multiple sources to convert.
Tip: Right-clicking in the source data column of the Data Mapping area opens a menu where you can choose to select or deselect all features and properties. - To apply a filter to the source data, right-click the data source and click Filter Source.
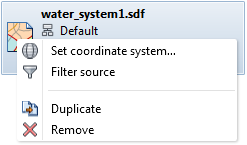
- If necessary, you can change the coordinate system assigned to the source data. Right-click the source and click Set Coordinate System.
- In the Data Mapping area, define the mapping between items in the source data and feature classes and attributes in the industry model data model.
If the source is DWG, you can create mappings from layers, entities, or blocks, to corresponding feature classes in the industry model. From the drop-down list, select Entity, Block Name,Layer, or Object Data.
To create mappings between particular attributes, click the attribute of interest in the source list, then click the drop-down list in the All Models column.
- When you have completed the mapping for a source, you can save the mapping as a profile. You can later reload the profile for future conversions. From the dropdown at the bottom of the Source Data list, click Save.
- To validate the connectivity of features and run design validation rules, select Reinitialize and Validate Topology.
This option will display any connectivity and rule errors encountered in the Topology Checker palette when the source data is converted.
- When you have finished creating the mapping between the source and the industry model, click Convert.
Apply styling and theming
Easily update styling using the style editor and use themes to display data to indicate different values.

Build topologies
Create topologies to perform useful calculations, such as identifying customers downstream from a faulty pump.
After you have created a drawing topology, you can use it to analyze spatial relationships between the drawing objects. You can:
- Extract or create new information about a set of objects
- Determine the distribution of an object, or objects, over a network or area
- Manage relationships between objects
- Analyze the location, proximity, and orientation of objects
- Evaluate suitability and capability, estimate, predict, and interpret
- Identify conditions at a geographic location, in a spatial area, or along a linear network, and predict effects of future events on these items

The three types of topologies: polygon, network, and point.
Different topologies can contain information on different aspects of a map. For example, a political map shows county lines or cities and towns. A geological map shows soil types or contour lines. A social map might show the locations of crimes or high-income areas.
Before you can analyze a topology, you must create the topology and make sure it is loaded.
Analyze data with tools
Use robust functionalities, including buffers, overlay, and spatial queries, to analyze data.
 Need Autodesk AutoCAD support?
If you would like to purchase AutoCAD licenses or need support, please contact us at info@microsolresources.com. Our team will assist you in getting the assistance you need.
INDUSTRIES: MEP Engineering